15-Minute London Open Strategy: RSI Divergence and Range Fades
Reviewed: . Examples are educational; they are not live trading signals.
This London-open setup looks for a failed move beyond an Asian-session range and then trades back toward the range. It uses a 15-minute chart and RSI divergence. Despite the word breakout appearing on the charts, the original trade direction is a fade: buy a rejected downside break or sell a rejected upside break.
The examples below are retained from the original article, including a losing USD/JPY setup. They explain the idea but do not establish a win rate. The rules also need an exact trigger and execution assumptions before they can be tested consistently.
The original rules, preserved
- Study pairs: GBP/USD and EUR/USD were the original preferences; that is not evidence that the method works on them.
- Chart: 15 minutes, with RSI set to 14 periods.
- Asian range: the high and low from 00:00 to 06:00 GMT, treated here as a fixed UTC window.
- Long idea: a move below the range with bullish RSI divergence, followed by rejection of the downside move.
- Short idea: a move above the range with bearish RSI divergence, followed by rejection of the upside move.
- Original stop reference: 10 pips beyond the breakout candle's low for a buy, or high for a sell.
- Original target ideas: projections related to the Asian range width, or a target based on five-day ATR.
The original text did not fully specify the entry confirmation or the exact origin of every target projection. A later close back inside the range is one possible confirmation rule to test, not an unchanged original requirement. Do not enter solely because divergence appears on an unfinished candle.
Keep the range window separate from London time
The fixed 00:00–06:00 UTC range does not move with British daylight saving. If you study 08:00 London local time as the opening-session reference, it corresponds to 08:00 UTC in winter and 07:00 UTC during British Summer Time. The UK Government clock-change guide explains the annual changes.
Check the broker's chart-server offset for the historical date, not just today's offset. Forex has no single central exchange opening bell, so define the observation window in your journal. Applying the idea to New York would require a separately specified session and test.
Read RSI divergence at identifiable swings
Bullish divergence compares a lower price low with a higher RSI low; bearish divergence compares a higher price high with a lower RSI high. MetaQuotes documents RSI divergence, but a disagreement between price and the oscillator does not ensure a reversal. The compared swings must already be identifiable when you make the decision.
Correcting the target terminology
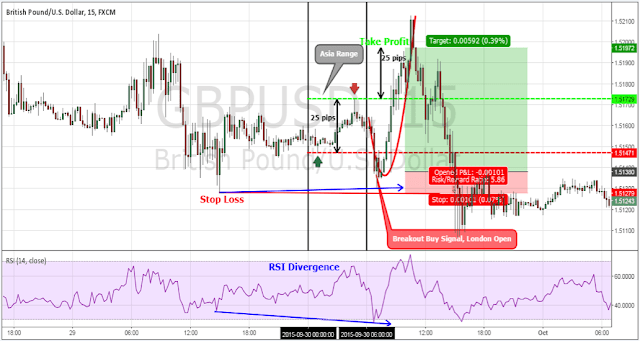
The older article called a move of one or two Asian-range widths “one or two standard deviations.” That is incorrect: the range high minus range low is a distance, not a statistical standard deviation. The legacy labels on the charts should be read as range projections.
For a transparent hypothetical rule, define range width W = high − low and project a target one W from entry in the trade direction. If W is 25 pips, that target is 25 pips from entry; two W is 50 pips. This specifies an otherwise ambiguous projection and is an example to test, not a claim about the original chart's exact order.
A Fibonacci drawing tool can be used as a ruler for chosen percentage projections, but that does not add predictive power or turn W into standard deviation. The alternative five-day ATR idea also needs an explicit anchor and multiplier. ATR is a volatility measure, not a promise that the remaining session will travel that distance.

Study the failed setup too

The failed example is a reason to investigate range width and directional conditions, not proof that a particular filter solves the problem. If you add a maximum range width or a news exclusion, state it numerically before testing and keep the revised results separate.
The original 10-pip stop buffer also needs checking against spread, volatility and position size. A stop can fill worse than planned, and adding a buffer without reducing size can increase cash risk. Before testing live, record demo examples, actual costs and missed signals, then apply the risk-planning guide and expectancy calculation to the complete method.
Sources and further reading
- MetaQuotes: RSI and divergence definitions
- UK Government: GMT/BST clock changes
- MetaQuotes: Average True Range
Follow the related learning path in Forex Strategies.


No comments